
Product technology

LightTools curves and spectra: reading solar street light optical reports

Jul 2026 Shenzhen engineering team 2 min read
Back to Media Center

Beyond IES / LDT photometric files, many solar street light manufacturers include LightTools distribution plots and spectral charts in technical packs to show lens design, LED selection and road optic fit. This note explains how to read both and cross-check DIALux output and datasheet values before bidding.

What to read on a LightTools plot

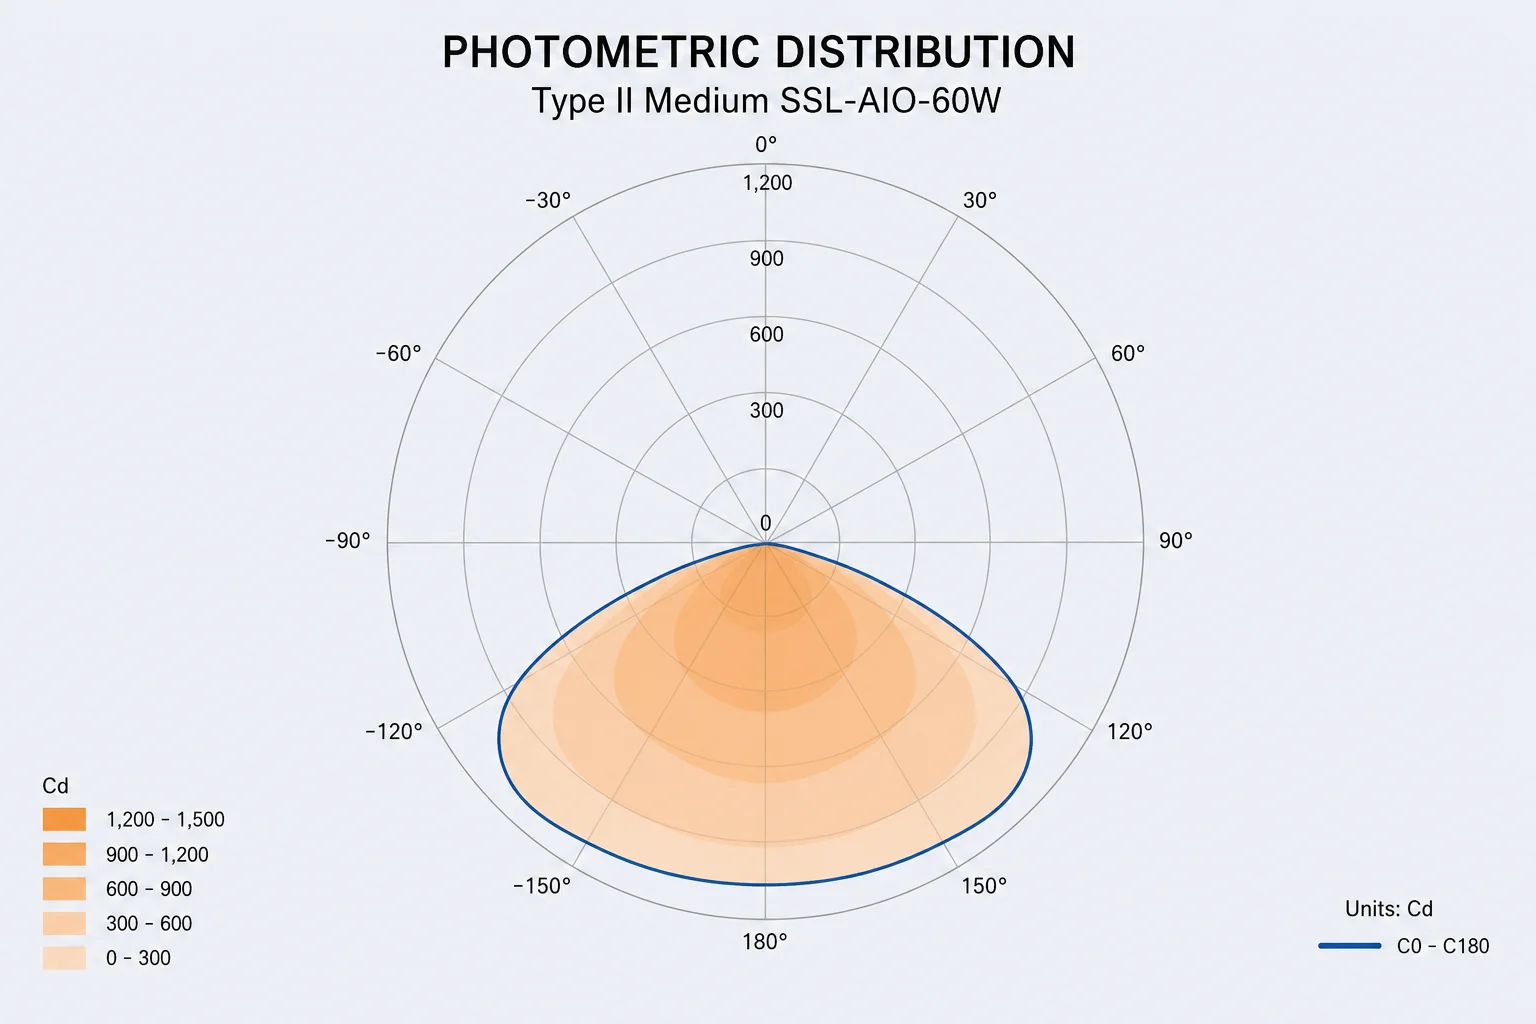
  • Polar candela distribution: 0° is typically nadir; curve shape maps to Type II / III / Below lateral coverage
  • Peak intensity and angle: Peak cd and its angle drive far-field illuminance and glare — must align with the IES candela table
  • Half-max beam angle (FWHM): Angle where intensity falls to 50% of peak — narrow for walkways, wider for carriageways
  • Backlight: Energy in the 90°–180° zone affects BUG ratings and uplight limits

Spectral charts and road lighting

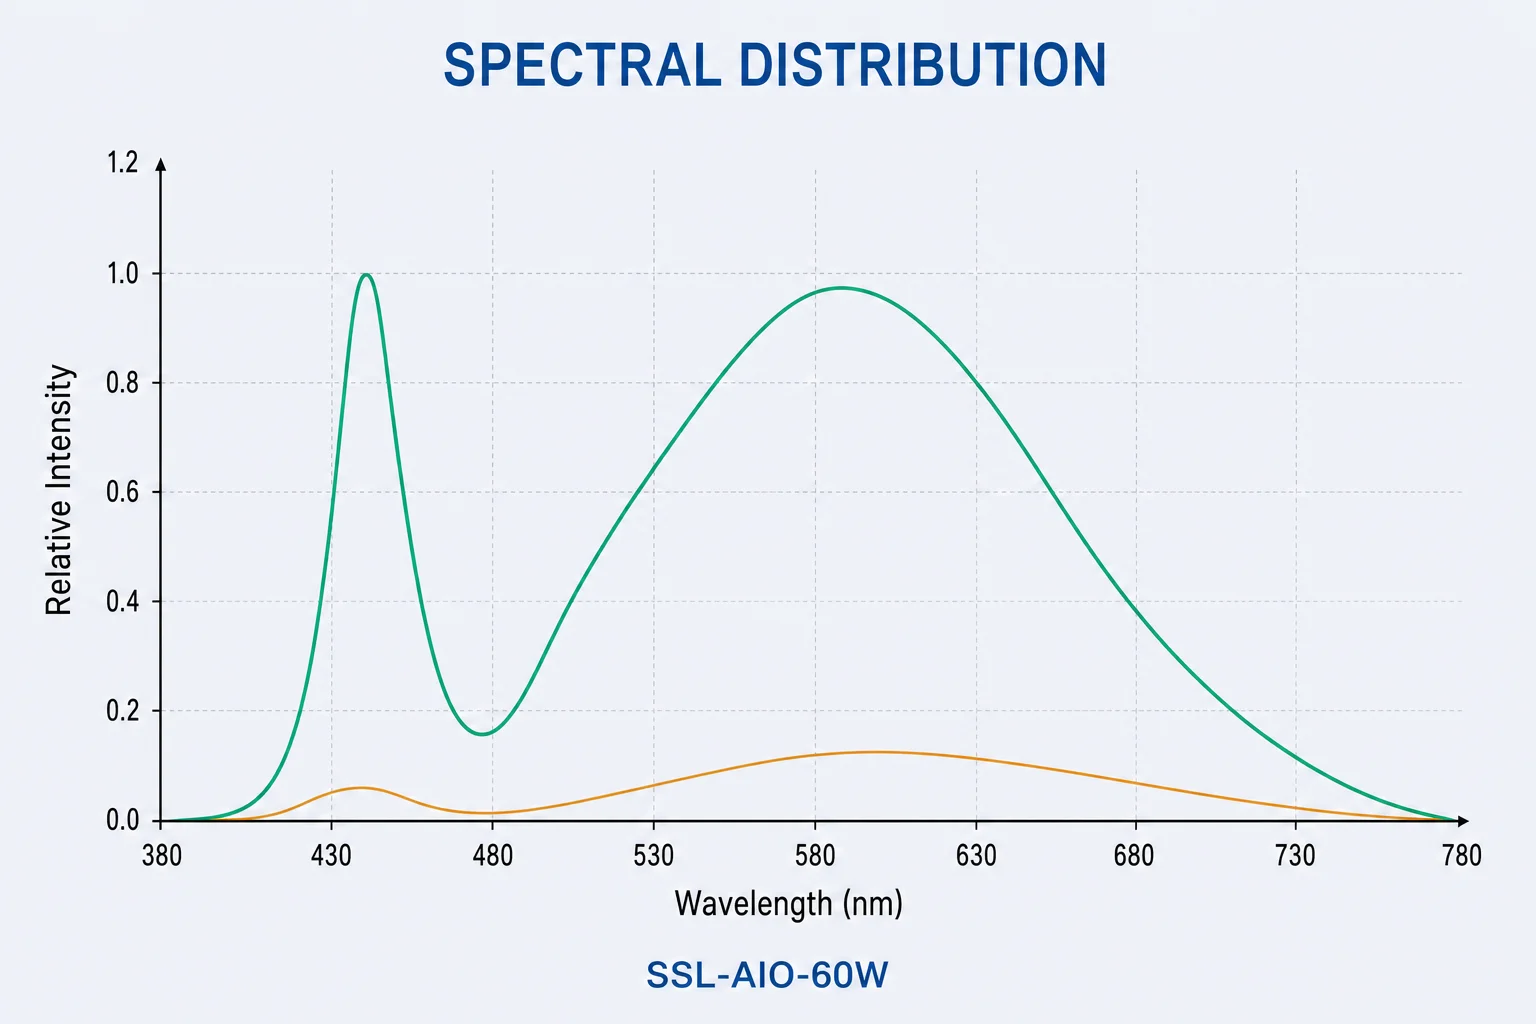
  • CCT: Campus and municipal roads often use 3000K–5700K; match the measured spectrum if the RFP caps CCT
  • CRI / Ra: Functional road lighting typically Ra≥70; campus or retail feeders may require higher values
  • Spectral shape: Narrow-band LED spikes can affect cameras and sensors on smart-lighting projects

Cross-check with IES and DIALux

  1. Total lumens from the plot (or integrated from the curve) should be close to rated lumens in the IES [LUMINAIRE] block
  2. Main throw direction and Type class should match pole height and road width per our road-class optic selection guide
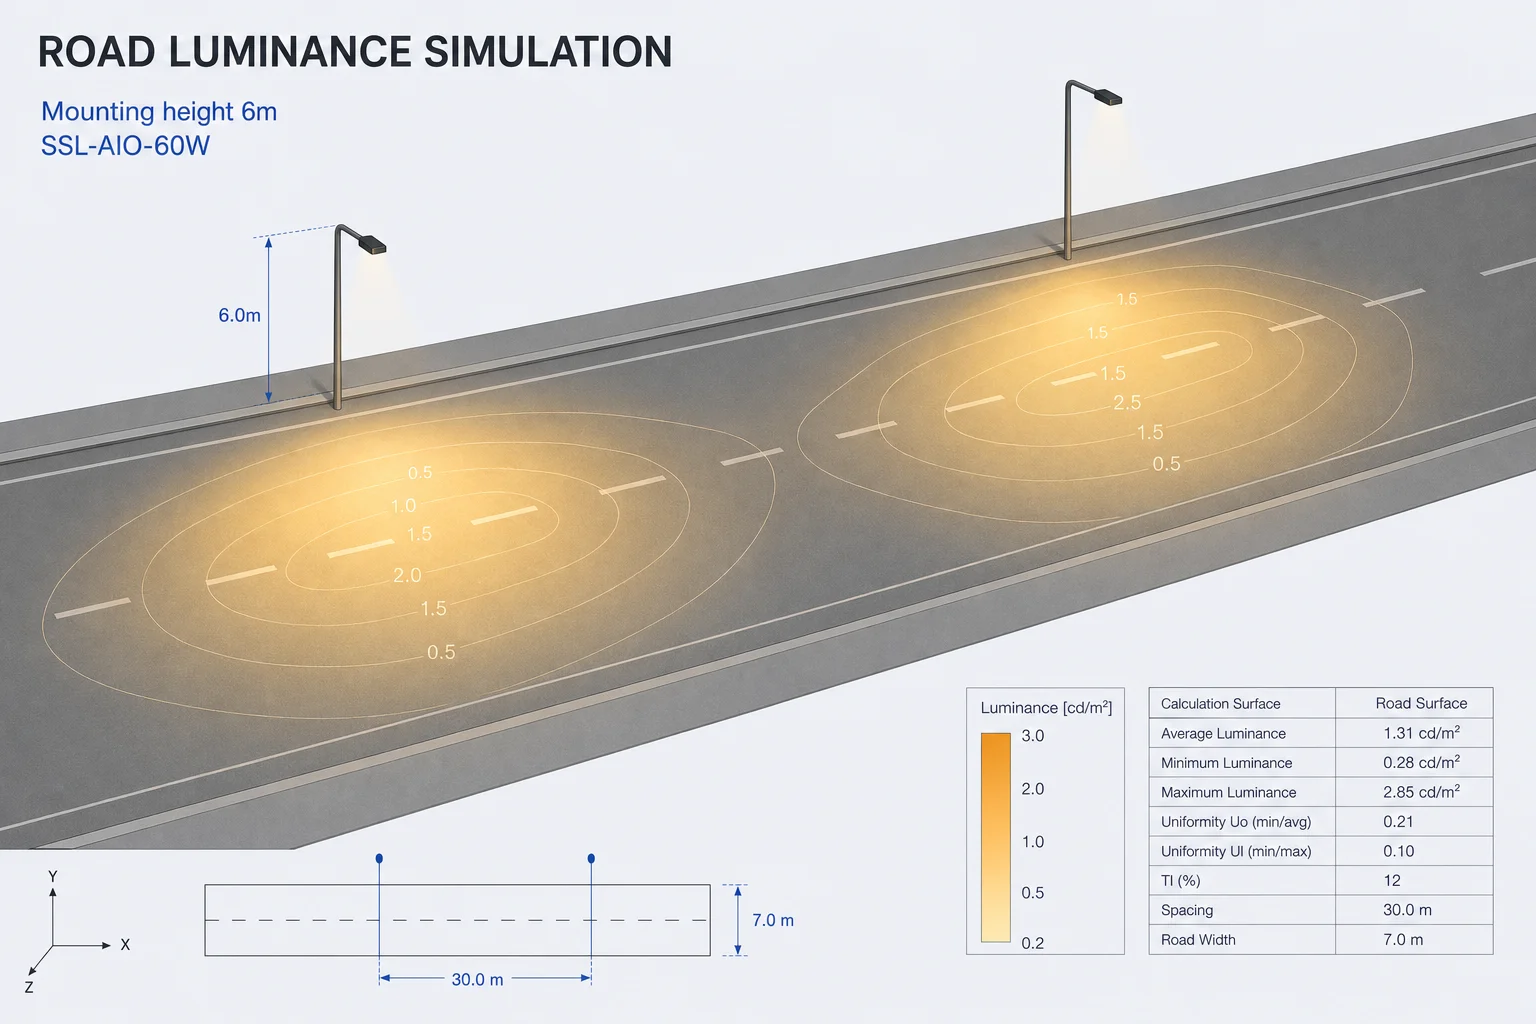
  3. Import the same IES into DIALux and compare with the manufacturer's reference captures (see our DIALux road simulation note)
  4. If curve, IES and datasheet lumens diverge by more than ~5%, request batch goniophotometer or integrating-sphere reports from the factory

Recommended optical request list

For tender volumes, bundle: native IES/LDT, LightTools or goniophotometer PDF summary, typical CCT spectrum chart, recommended height/spacing table and standard DIALux layout captures. Our Shenzhen factory packs these per model and notes the test workflow (LM-79 style photometry where applicable — confirm per project).

"When curve, spectrum and IES align, the technical volume is far stronger than lumens on a datasheet alone."

— Optics engineer, Shenzhen factory

Related articles

Explore more news and insights from our team

Product technology

LightTools curves and spectra: reading solar street light optical reports

Jul 2026 Shenzhen engineering team 2 min read
LightTools curves and spectra: reading solar street light optical reports

Beyond IES / LDT photometric files, many solar street light manufacturers include LightTools distribution plots and spectral charts in technical packs to show lens design, LED selection and road optic fit. This note explains how to read both and cross-check DIALux output and datasheet values before bidding.

What to read on a LightTools plot

  • Polar candela distribution: 0° is typically nadir; curve shape maps to Type II / III / Below lateral coverage
  • Peak intensity and angle: Peak cd and its angle drive far-field illuminance and glare — must align with the IES candela table
  • Half-max beam angle (FWHM): Angle where intensity falls to 50% of peak — narrow for walkways, wider for carriageways
  • Backlight: Energy in the 90°–180° zone affects BUG ratings and uplight limits

Spectral charts and road lighting

  • CCT: Campus and municipal roads often use 3000K–5700K; match the measured spectrum if the RFP caps CCT
  • CRI / Ra: Functional road lighting typically Ra≥70; campus or retail feeders may require higher values
  • Spectral shape: Narrow-band LED spikes can affect cameras and sensors on smart-lighting projects

Cross-check with IES and DIALux

  1. Total lumens from the plot (or integrated from the curve) should be close to rated lumens in the IES [LUMINAIRE] block
  2. Main throw direction and Type class should match pole height and road width per our road-class optic selection guide
  3. Import the same IES into DIALux and compare with the manufacturer's reference captures (see our DIALux road simulation note)
  4. If curve, IES and datasheet lumens diverge by more than ~5%, request batch goniophotometer or integrating-sphere reports from the factory

Recommended optical request list

For tender volumes, bundle: native IES/LDT, LightTools or goniophotometer PDF summary, typical CCT spectrum chart, recommended height/spacing table and standard DIALux layout captures. Our Shenzhen factory packs these per model and notes the test workflow (LM-79 style photometry where applicable — confirm per project).

"When curve, spectrum and IES align, the technical volume is far stronger than lumens on a datasheet alone."

— Optics engineer, Shenzhen factory
Need a solar street light solution?

Contact our engineers for quotations, IES files and technical consultation.

Explore more news and insights from our team